
The names Dow Jones and S&P 500 are familiar from the evening news and financial periodicals. There are several other stock indexes that represent different market sectors in the United States, but the Dow and S&P are the most well-known. Although they both index the major American stocks and have a lot in common, they are not the same.
Dow Jones
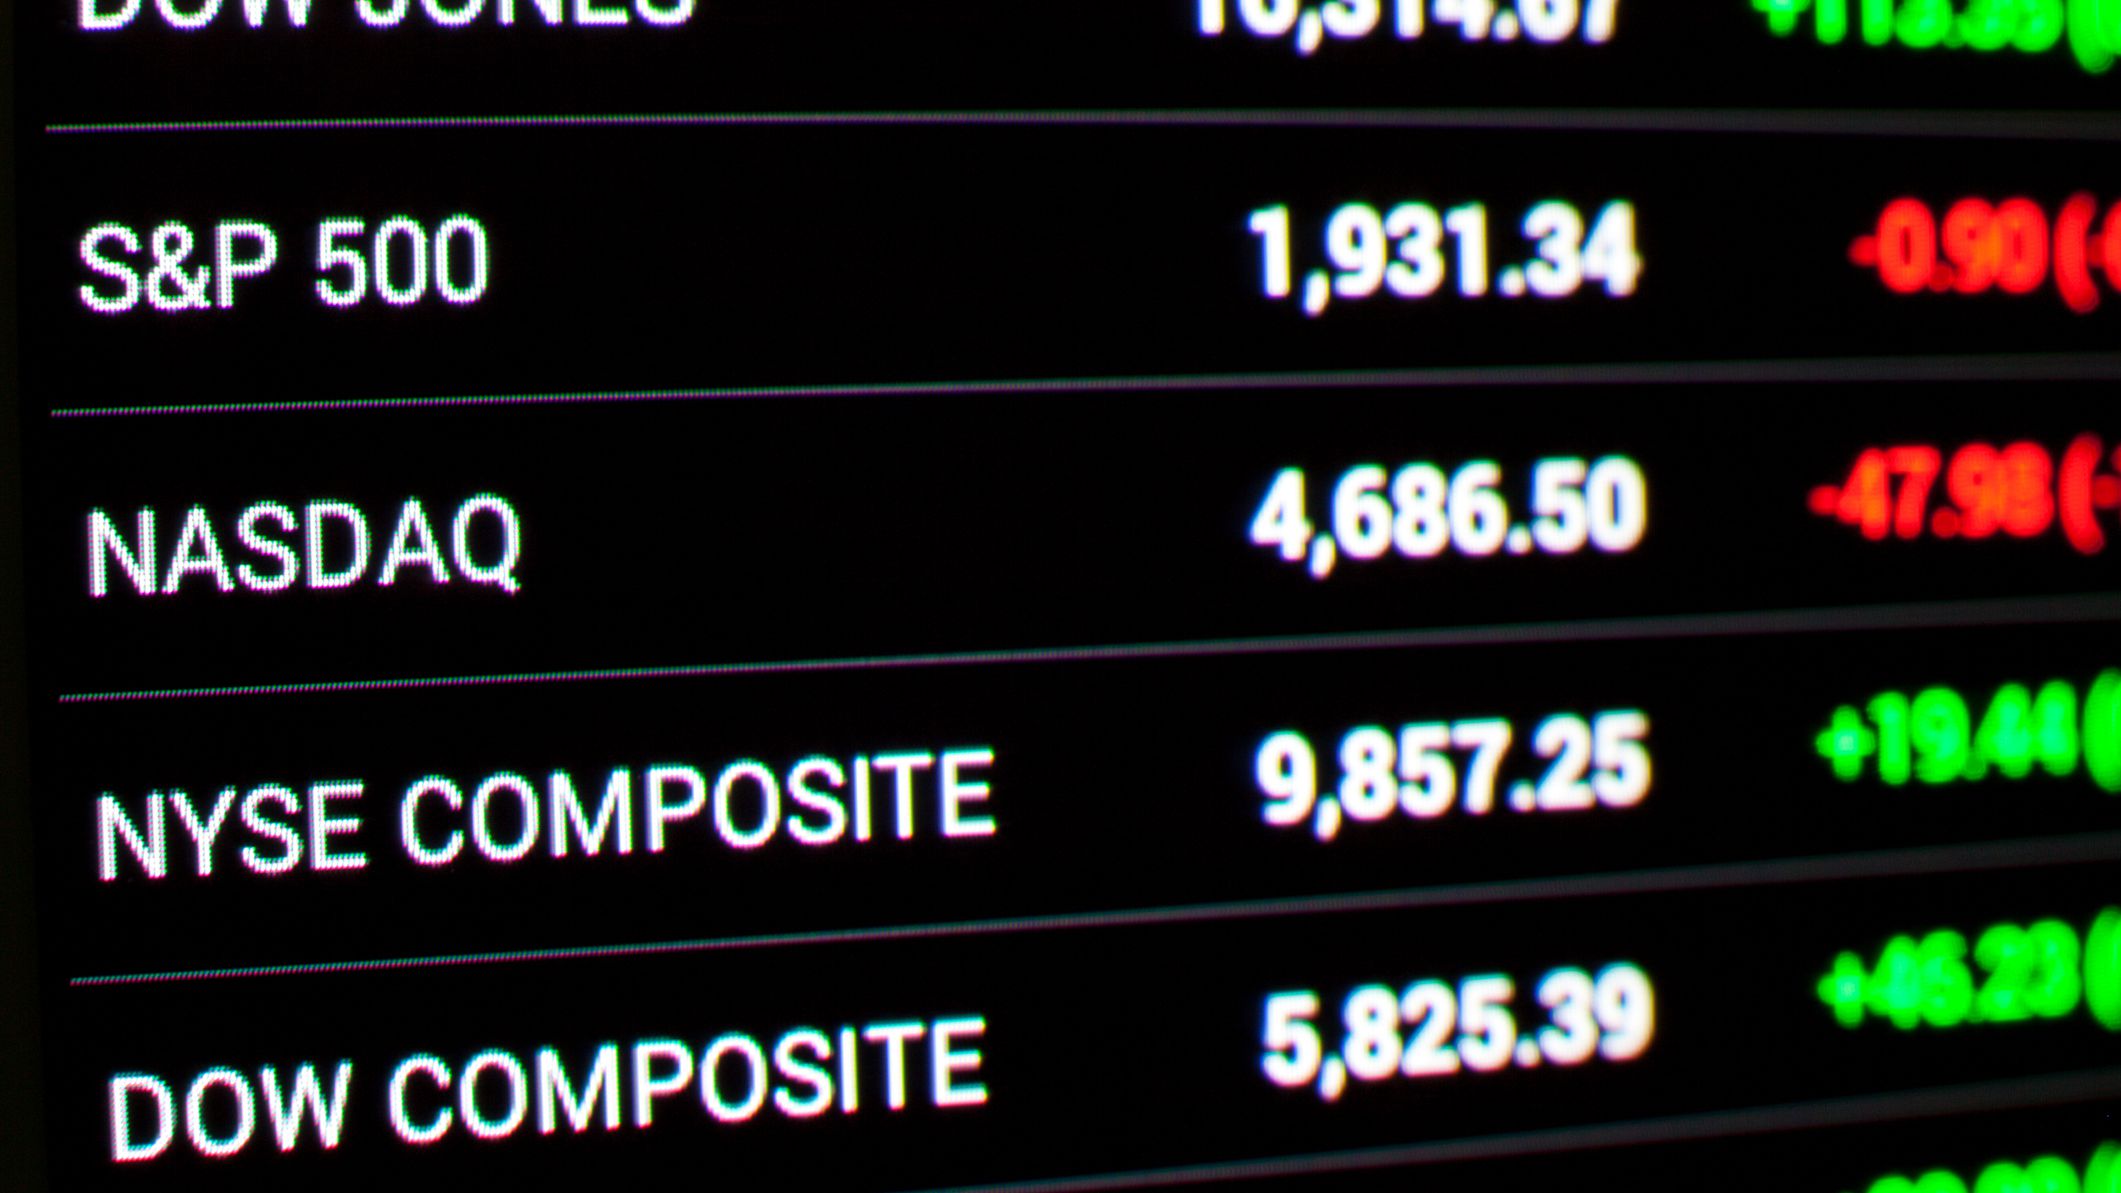
Known as the Dow Jones Industrial Average, it is a measure of the stock market (DJIA). The DJIA is probably the most well-known stock market indicator, as well as one of the most exclusive. Only 30 stocks make up the “Dow,” all of which are among the country’s largest, wealthiest, and most heavily traded corporations. Except for utilities and transportation, which have their own Dow Jones indices, the Dow includes firms from all major industries. Although many people consider the DJIA to be an indicator of the broader market, the Dow’s moves actually primarily reflect the performance of significant “blue chip” stocks.
Only one of the original twelve is still in the index today: General Electric. While the index used to be made up entirely of industrial enterprises, the current 30 equities cover a wide range of industries. The editors of “The Wall Street Journal” choose the members. ” Despite the fact that it has been operational for over a century, the Dow tries to keep current by occasionally replacing firms on the list based on market conditions. For example, in 1999, Sears Roebuck and Union Carbide were replaced by Microsoft and Home Depot, and in 2004, Eastman Kodak and International Paper were replaced by Pfizer and Verizon.
S&P 500
The Standard & Poor’s 500 index, sometimes known as the S&P 500, was initially published in 1957 and is currently considered one of the strongest gauges of the large-cap US equity market. It is supposed to be indicative of the entire domestic economy and is weighted by market capitalization. The index is made up of 500 top firms from a variety of industries, and it accounts for 75% of the stock market in the United States. Exxon, Johnson & Johnson, and Apple are just a few of the well-known corporations on the list. The S&P 500 includes companies that are listed on the Dow Jones index.
Nasdaq Index
There are almost 3,300 equities on the Nasdaq Stock Market’s composite index, making it the most comprehensive. As a result, it has a far broader appeal than the Dow Jones Industrial Average. Consequently, the Nasdaq Composite Index is more sensitive to movements in the technology sector than other sectors. When comparing the composite index to the Nasdaq Composite, it is important not to mistake these two indexes.
Charles Dow, the founder of “The Wall Street Journal,” created the Dow Jones Industrial Average in 1896. The S&P 500 was established in 1957. S&P Dow Jones Indices, a division of Standard and Poor’s, now maintains both indices. Since its inception in 1971, the Nasdaq composite index has been issued by the Nasdaq stock market. A company’s stock price is used to establish the value of each index. However, the stocks in each index are “weighted,” which means that some have a greater impact on the index’s overall value than others. The weighting is based on the share prices of firms, their current market worth, and other variables.
Despite their close association, the major U.S. indices each have their own ‘personalities’ in terms of how they trade, due to the differences in their make-up and the prominence of certain corporations and groupings of companies (sectors). Because it is made up of so many different stocks, the S&P 500 has the least impact from day to day. With that said, the index’s most important sectors are a small number of them.
Previous sectors have significantly outperformed or underperformed during various economy cycles, hence the largest driving sector has shifted over time. There have been a number of shifts throughout time, from oil to technology to financials to IT, which presently has a 26% share of the total market capitalization of companies. The Dow, on the other hand, is more highly impacted by the performance of individual stocks since there are just 30 securities. As it stands, the Dow’s top ten stocks account for more than half of its value, making it simple to see how large price movements in just a few tickers may have a greater impact.
The Nasdaq 100 has a larger number of members than the Dow, but the influence of a smaller set of stocks is much greater.There are just ten Nasdaq 100 companies that make up over half of its value, while the other ninety percent make up less than half of the index’s worth.
As a result, the index is top-heavy and extremely sensitive to price changes in a small number of firms.
It’s worth noting that during earnings season each quarter, when companies publish their results and respond with significant price fluctuations, you’ll often notice the widest divergence between the weightings in the indices. As a rule of thumb, on these days, the Dow Jones Industrial Average and the Nasdaq 100 have greater overnight gaps than the S&P 500. Blue-chip corporations like Boeing, United Healthcare, and 3M make up a large portion of the Dow Jones, making it the least volatile of the three main indexes in terms of volatility. Although all three indexes have their share of risky, fast-growing companies, the Nasdaq 100 has a higher concentration of these companies (Google). The S&P 500’s volatility is usually somewhere around the middle.
Market players use a variety of methods to construct their views on indices, just as they do for any other asset class. For short- to intermediate-term traders (including day traders), technical analysis tends to play a key role, but long-term investors prefer to put a greater emphasis on fundamental research.
There is one feature that distinguishes equity indices from other types of indices. The great majority of market participants are long the stock market in some form due to the fear factor associated with losses. As a result, drops tend to unfold far faster than rallies.